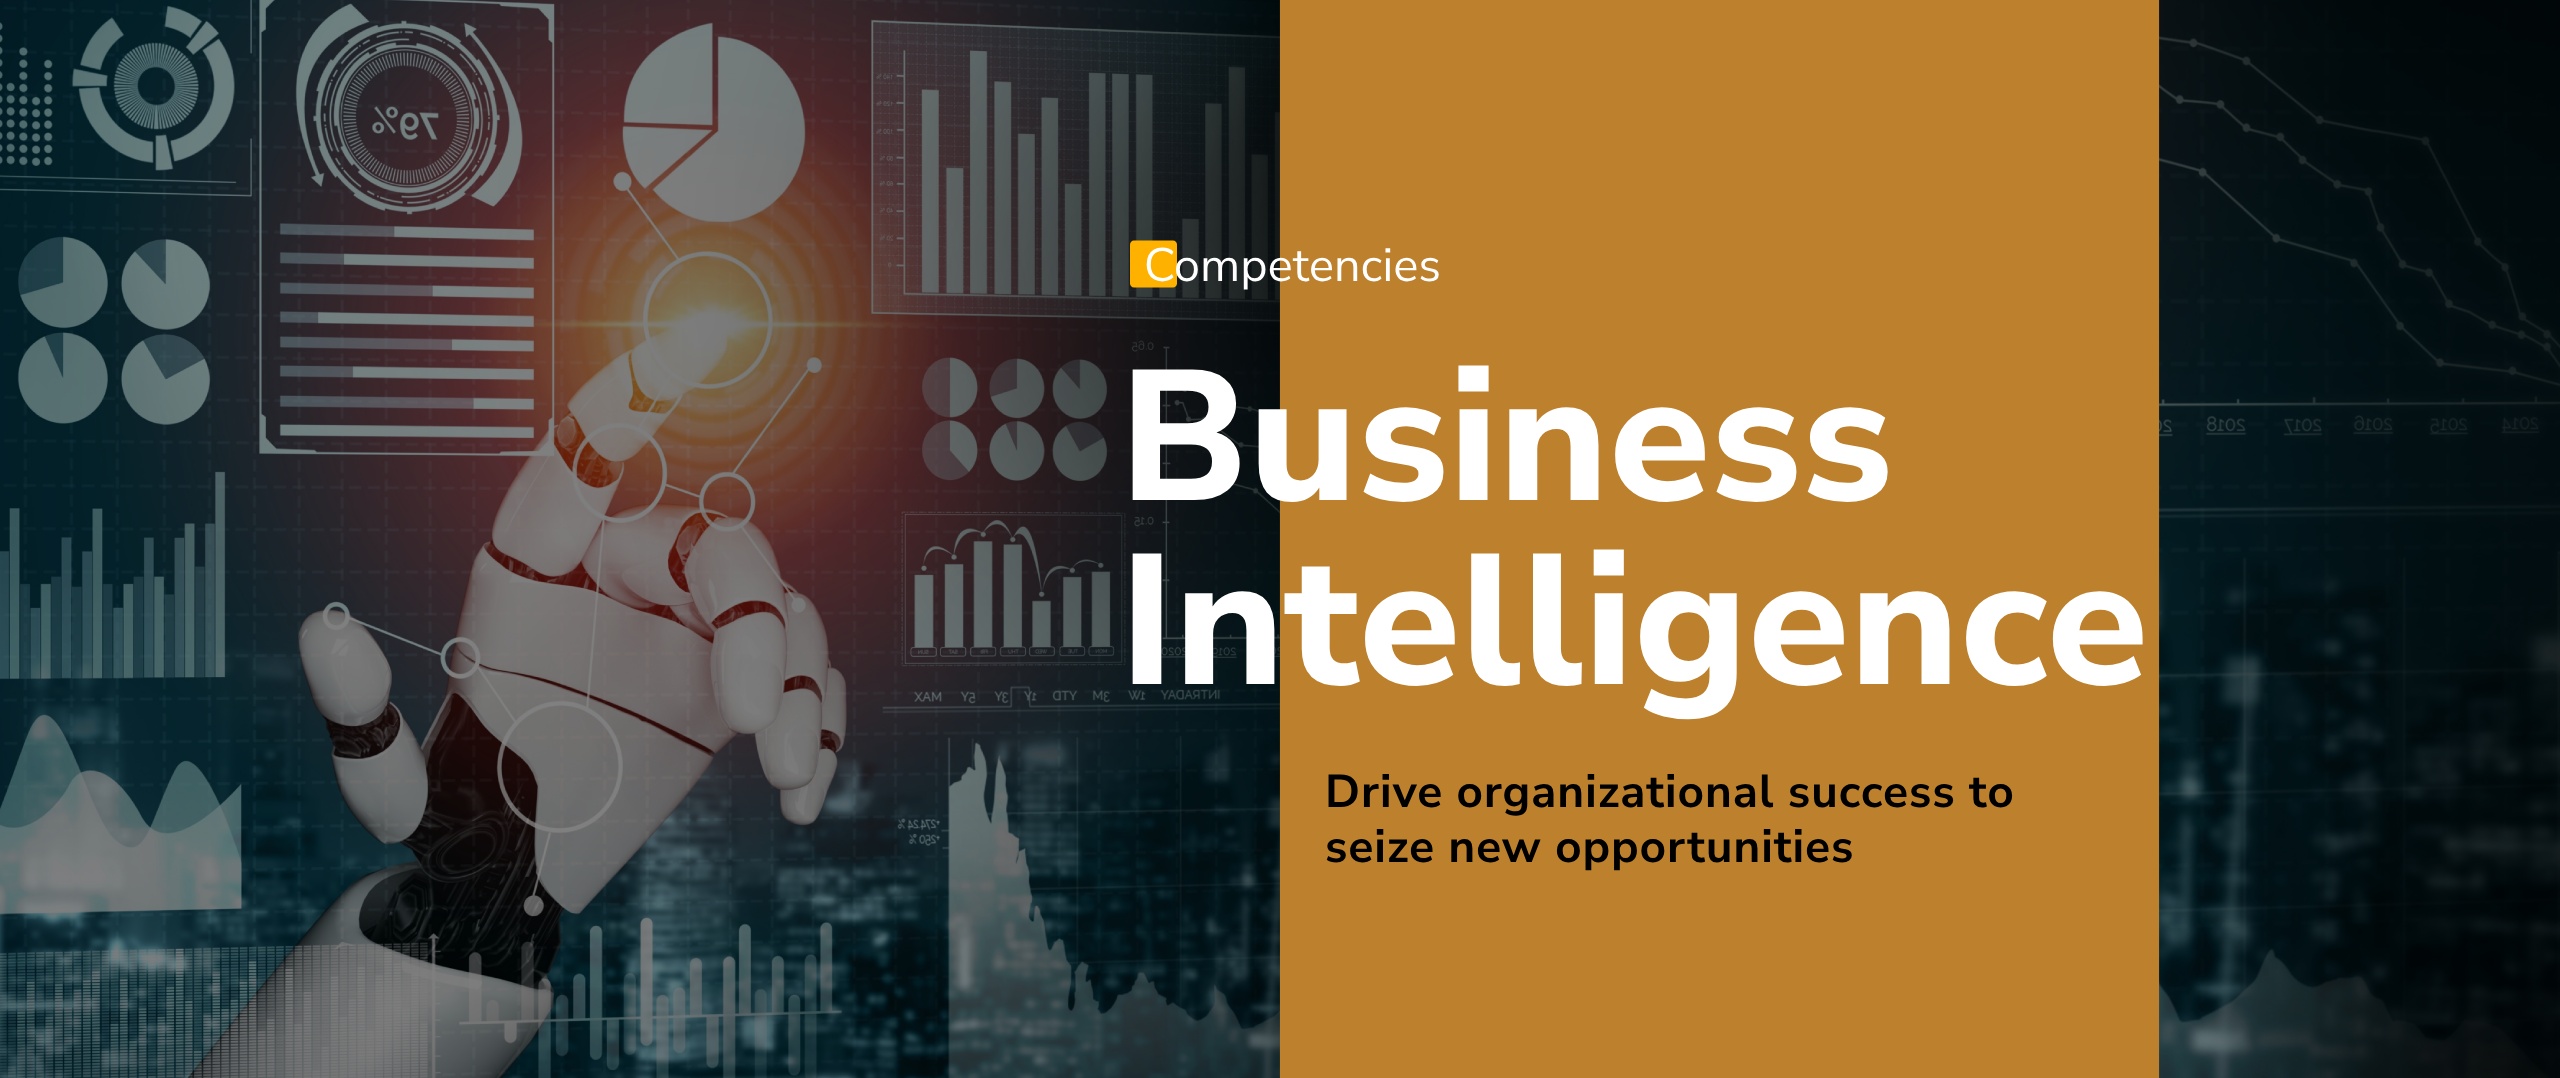
Data is abundant, but what businesses lack is insights. This is where Lera takes control. Our ensemble of Business Intelligence Solutions is designed to meet finesse. By harnessing the power of AI, ML, GenAI, and GenBI, we enable the true democratization of data, making intelligence accessible, actionable, and strategic across the board.
Our Business Intelligence (BI) services strategy includes a built-in automation and intelligence system to prepare and model data with ease. We enable organizations to bring data to life through visualizations and AI-powered features. Using actionable insights, we help understand the ‘why’ behind the outcomes. Remove guess work and apply analytical information to optimize business processes, tasks, and activities with our BI tools.


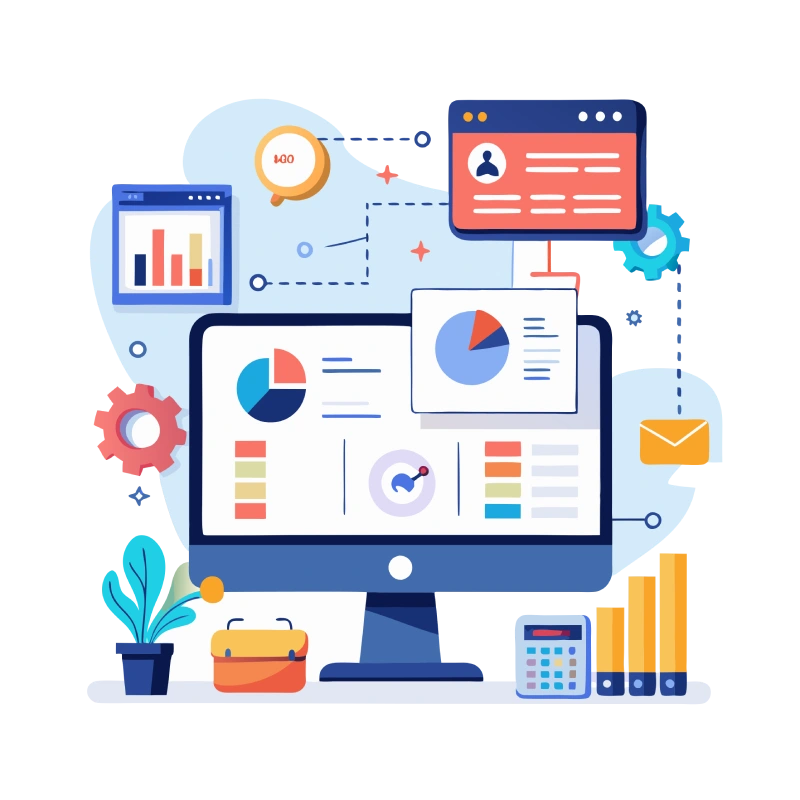
Empower your business with tailored data visualizations and reports designed to meet your unique needs. Go beyond standard templates to create insightful, interactive dashboards that uncover trends, deliver meaningful insights, and drive smarter decisions.
Real-time reporting provides instant insights by processing data as it's generated, ideal for tracking live sales or website traffic. Batch reporting processes data at scheduled intervals, perfect for end-of-day summaries or monthly reviews. Both methods support data-driven decisions, suited to different business needs.
Go beyond basic graphs and charts with interactive elements that bring data to life. Advanced visualizations like 3D plots and real-time dashboards enhance reporting, offering deeper insights and improved data exploration for smarter decision-making.
Equip users with intuitive tools to explore, analyze, and visualize data independently. Self-Service BI enables teams to uncover insights without constant IT support, driving faster decisions and greater business agility.
This concept encompasses operational, financial, and analytical reporting to deliver actionable insights, monitor performance, identify trends, and support strategic, data-driven decision-making for improved business outcomes.
Streamline compliance and regulatory reporting with efficient, scalable services that ensure accuracy, enhance transparency, support global requirements, and reduce operational costs.


Lera’s flexible engagement models—Time & Materials, Factory, and Fixed Price—empower businesses to streamline data integration, enhance reporting accuracy, and drive intelligent decision-making. Whether you need on-demand BI expertise, scalable data solutions, or predictable cost structures, our models ensure agility, efficiency, and transparency. By leveraging Strategic Outsourcing, Expert Resource Augmentation, and Agile Workflows, we enable seamless data transformation for sustainable growth.
Turn Data into Actionable Intelligence with Lera.